Performance Report - 2022
The following information is required to be collected and reported by all colleges in the State and is provided as mandated by the North Carolina General Assembly and the North Carolina Community College System (NCCCS). Data reported below is from the 2022 Performance Measures for Student Success report published by NCCCS. Seven measures are evaluated with established baseline and excellence levels. Baseline levels are set two standard deviations below the system's average index score, and excellence levels are set one standard deviation above the system’s average index score. The average band is within 0.5 standard deviations above or below the average index score. In the most recent report, WPCC students exceeded the excellence level on three measures, were below excellence but above the system average band on three measures, and were within the average band on one measure. WPCC strives for students to meet or exceed the excellence level on all measures.
1) Basic Skills Student Progress
Purpose: To ensure individuals with low literacy skills are progressing academically toward credential or employment.
Description: Index score based on the percentage of Basic Skills periods of participation (POP) with a measurable skill gain (MSG).
|
Results: 2020-2021 Basic Skills Student Progress
|
|
Excellence
|
1.348
|
|
Mean
|
0.993
|
|
Baseline
|
0.283
|
|
WPCC
|
1.213
|
2) Student Success Rate in College-Level English Courses
Purpose: To ensure students are successfully completing a credit-bearing English course within their first three academic years.
Description: Index score based on the percentage of first-time fall associate degree seeking and transfer pathway students passing a credit-bearing English course with a “C” or better within three years.
|
Results: 2018 Fall Cohort Student Success Rate in College-Level English Courses
|
|
Excellence
|
1.147
|
|
Mean
|
1.014
|
|
Baseline
|
0.747
|
|
WPCC
|
1.293
|
3) Student Success Rate in College-Level Math Courses
Purpose: To ensure students are successfully completing credit-bearing Math courses within their first three academic years.
Description: Index score based on the percentage of first-time fall associate degree seeking and transfer pathway students passing a credit-bearing Math course with a “C” or better within three years.
|
Results: 2018 Fall Cohort Student Success Rate in College-Level Math Courses
|
|
Excellence
|
1.192
|
|
Mean
|
1.016
|
|
Baseline
|
0.662
|
|
WPCC
|
1.270
|
4) First Year Progression
Purpose: To ensure first-year students are making progress toward credential completion.
Description: Index score based on the percentage of first-time fall credential-seeking curriculum students who graduate prior to or enroll in postsecondary education during the subsequent fall term.
|
Results: 2020 Fall Cohort First Year Progression
|
|
Excellence
|
1.069
|
|
Mean
|
1.003
|
|
Baseline
|
0.872
|
|
WPCC
|
1.012
|
5) Curriculum Completion
Purpose: To ensure student completion and/or persistence toward a post-secondary credential in a timely manner.
Description: Index score based on the percentage of first-time fall credential-seeking curriculum students who have graduated, transferred, or are still enrolled during the fourth academic year with 42 successfully completed non-developmental hours.
|
Results: 2017 Fall Cohort Curriculum Completion
|
|
Excellence
|
1.094
|
|
Mean
|
1.014
|
|
Baseline
|
0.853
|
|
WPCC
|
1.056
|
6) Licensure and Certificate Passing Rate
Purpose: To ensure programmatic coursework prepares students to competently practice their chosen profession.
Description: Index score based on the percentage of first-time test-taker passing licensure and certification exams within each exam. Exams included in this measure are state mandated exams which candidates must pass before becoming active practitioners.
|
Results: 2020-2021 Licensure and Certification Passing Rate
|
|
Excellence
|
1.073
|
|
Mean
|
0.982
|
|
Baseline
|
0.800
|
|
WPCC
|
1.076
|
7) College Transfer Performance
Purpose: To ensure the academic success of community college students who transfer to a four-year university or college.
Description: Index score based on the percentage of community college associate degree completers and those who have completed 30 or more articulated transfer credits who subsequently transfer to a four-year university or college during the fall semester who graduate prior to or remain enrolled at any four-year college or university the subsequent fall semester.
|
Results: 2019-2020 Community College Students College Transfer Performance
|
|
Excellence
|
1.024
|
|
Mean
|
0.990
|
|
Baseline
|
0.922
|
|
WPCC
|
1.009
|
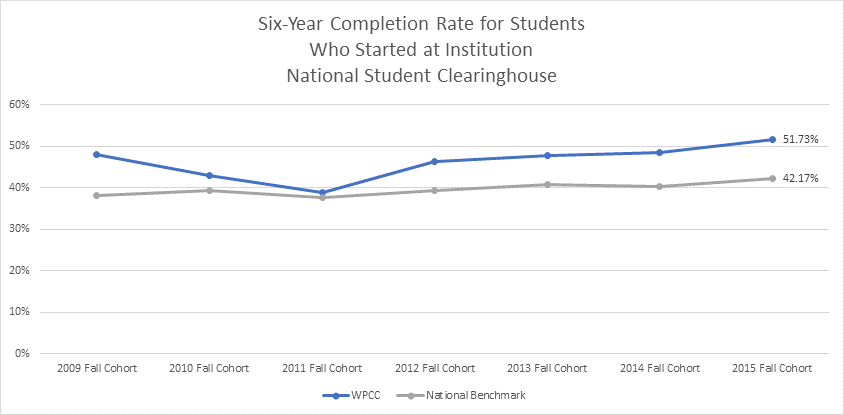
In addition to the measures listed above, WPCC monitors the six-year completion rate for students who started at the College. This data is provided by the National Student Clearinghouse and includes both full-time and part-time students who began their post-secondary studies at WPCC. The College's goal by 2030 is to be 11% higher than the national benchmark. Note that the 2030 report will reflect the 2024 Fall Cohort. (Statement amended 5/23/23.)
![]()
![]()
![]()
![]()
![]()